Welcome to this week’s State of the Markets with Wayne Nelson and Seth Golden. Please click the following link to review the SOTM video. The potential beginnings of a market pullback that began last week continued into and through this week with the S&P 500 falling more than 2% on the week. Corrections are a normal process of any bull market and encourages futures gains as cash on the sidelines is more readily put to work in the market. With this week’s drawdown, the S&P 500 has wiped out its YTD gains and finished slightly lower in January 2020. Uncertainty and a wall of worry have provided investors with an excuse to take profits. We encourage viewership of the weekly SOTM to include reading the notes that accompany the weekly video, below. We suggest the bull market will carry forward, but not higher in a straight line and not without a near-term correction.

- We think a likely place to expect markets to find some footing is maybe 50-DMA, but more likely between 100-DMA and 200-DMA moving average.
- Fundstrat

- Aggregate dealer Gamma briefly turned negative on Monday, and remains close at SPX~3250.
- SG Derivs Strategy shows a history of prior sustained Gamma breaks – when dealers began hedging into falling markets, amplifying Volatility.
- Relevant signal to watch closely here.

- When the HIV/AIDS epidemic became known in 1981 the market was suffering from the nasty double-dip recession from 1980-1982. The Iraq War held the market down in early 2003 during the SARS outbreak. The sovereign debt crisis and the downgrade of US debt in 2011 likely hurt the market more than the horrendous Haitian Cholera outbreak. The Measles scare in the US in late 2014-early 2015 had little impact on the market, though we suffered a mini-bear in 2015-2016 due to the EU Sovereign Debt Crisis, Brexit fears and the Chinese bear market.
GS: We estimate a 0.4pp “corona” drag on US annualized growth in Q1
- Followed by a subsequent rebound boosting Q2 growth by 0.3-0.4pp, leaving only a small net drag on US full-year 2020 growth of around 0.05pp.
- The drag on growth operates mostly through lower tourism from China and lower US goods exports to China.
- Consistent with our estimate of a small net baseline drag, we do not find a clearly discernible effect of past pandemic scares on aggregate US activity. However, the risks around our baseline are skewed towards a larger hit because a change in the news flow could lead to increased risk aversion—less travel, commuting or shopping—or a sustained tightening in financial condition

Bernstein big investor survey on coronavirus
- Consensus feedback: “We’ve seen this kind of thing before, the authorities are more on top of this situation than they were with SARS, we’ll have a few quarters of a hit to Chinese GDP but it’s not going to be a serious global problem and hopefully any over reaction will present buying opportunities.”
- However, very few investors have made any changes to their portfolio allocations yet.
JPM: We shave off 0.3%-pt off of global growth this quarter due to corona
- That loss is then made up by 3Q20.
- The new forecast puts global growth at 2.3%ar in 1Q, 2.8%ar in 2Q, and 2.6% in 3Q.

- February’s performance, compared to other presidential-election-year months, is mediocre at best with no large-cap index ranked better than seventh (DJIA and S&P 500 since 1950, Russell 1000 since 1979).

- The amount of money consumers have left over after taxes, food, and energy is overall PCE divided by PCE excluding food and energy. That’s currently high compared to the past 3 decades.
- Energy spending as a percentage of PCE is near a record low. Consumers’ debt servicing is very low because consumers have deleveraged and interest rates are low.
- The savings rate is 7.9% (November). This leads us with the historically and cyclically strong consumer free cash flow index shown in the bottom chart below.

- The December consumer confidence index was revised higher by 1.7 points to 128.2.
- The January reading beat estimates for 127.8 as it came in at 131.6.
- The present situation index rose from 170.5 to 175.3 and the expectations index increased from 100 to 102.5.
- Consumers saying current conditions are good increased from 39% to 40.8%. Those saying conditions are bad fell from 11.1% to 10.4%.
- As you can see from the chart above, consumers have become even more confident in the current job market.
- Those saying jobs are “plentiful” rose from 46.5% to 49% and those saying jobs are “hard to get” fell from 13% to 11.6%. The net difference rose to 37.4%.

- Healthy rebound in small business CEO confidence as per WSJ/Vistage January survey.
- Strength in economic conditions, financial prospects, & expansion plans have improved sentiment since recent low in October 2019.

- Regional PMI surveys suggest meaningful upside for the ISM in January. Kansas & Richmond were noteworthy, both up despite their exposure to Boeing’s supply chain. Still waiting for Chicago, but for now Cornerstone’s model points to a 5 point gain.
- The Richmond index rose from -5 to 20. It more than doubled the highest estimate which was 9. It beat the consensus of -3, making this the largest beat since March 2009.

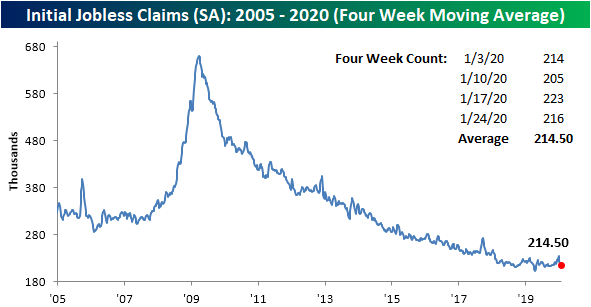
- Despite that upward revision, the four-week moving average has fallen for a fourth consecutive week.
- Now at 214.5K, it is at its lowest level since early October when the moving average was 213.75K.

- For the third straight month, investors’ average cash balance holds at 4.2%, the lowest level in almost seven years.
- We continue to see various reasons to buy the pullback in U.S. equities.
- Bank of America strategists argue that investors should be prepared to purchase the sharp pullbacks and then sell as markets surge higher thereafter.
- “Why buy the dip: a 3% drawdown cleared some positioning froth,” writes the strategist. Why sell the rip? “tech most overbought since dot-com bubble,” they write.

- B. of A. says a “good rule of thumb has been to buy stocks after the options market shows signs of panic,” pointing to surges in the Cboe Volatility Index.
- Bank of America also believes that heightened coronavirus fears could prompt the Federal Reserve, which held its policy interest rates steady at a 1.5%-1.75% range on Wednesday, to cut rates soon, which could provide an added fillip to markets, depending on how the market interprets such a monetary policy.

- “We note that since 2016 a VIX curve inversion saw the S&P 500 rally 1.6% on average over the next month,” writes the strategists.
- Jim Cramer and others have advised caution and warned investors of the perils of being too eager to buy pullbacks.
- “I just don’t think today” is the time to buy back into the market, he warned, adding that he sees potentially taking a “second leg” down if the World Health Organization were to declare a global emergency over the coronavirus.”

- Census data released showed new highs for the rebounding home ownership rate while the rental vacancy rate hit the lowest level in almost 40 years.
- Yet another green light for housing investment given low interest rates and a flat yield curve.

- 30-Year Mortgage Rate in the US moves down to 3.51%, only 20 bps above its all-time low (3.31% in 2012).

- US Real GDP and S&P 500 Returns since 1984.
- S&P 500 up more often when GDP is positive and on years when GDP is flat- down negative.
- Real GDP has only been negative once since 1984.

- Sanders’ lead in the betting markets moves up to 9% over Biden, the largest yet. A month ago Biden was leading Sanders by 11%.
- A Deutsche Bank poll indicated that 90 per cent of clients thought that a victory for Mr Sanders would be negative for the US stock market. The left-leaning US senator from Vermont is in the lead with a 39 per cent chance of winning the Democratic nomination, according to bets on PredictIt.
- Since 1928, only 4 of the 23 presidential election years have coincided with negative S&P 500 Index returns.
- Two of these four election years occurred during U.S. economic depression (in 1932) and recession (in 2008), while a third occurred during the recovery of the Great Depression (in 1940).
- This historical trend suggests to us that as long as the U.S. economy continues to grow and international events do not impede, equity markets have the potential to rise during presidential election years.


