The first trading day post the Saudi Arabia oil field bombings and speculative production slowdown pushed crude oil future (CLF) prices up roughly 15%, with equity prices moving lower Monday. Crude closed near it’s intraday high of roughly $63 per barrel while the S&P 500 (SPX) finished lower by nearly 10 points on the day. With regards to the ongoing sector rotation from last week, the large cap rotation into small caps continued, with the Russell 2000, the only major index to finish in the green by 6.5 points.
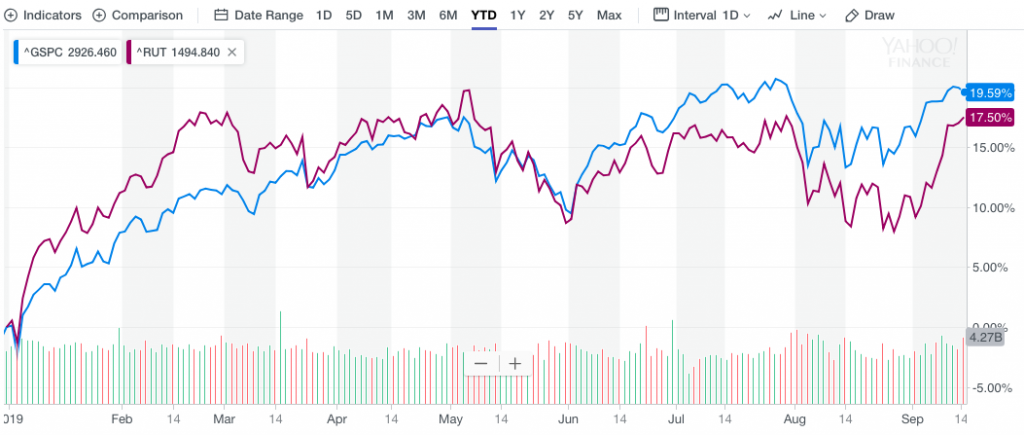
The gap that had widened between the S&P 500 and Russell 2000 (RUT) through August has now narrow in September to just 2 percent, as the Russell has outperformed its big brother index by roughly 2.25% over the last month. Now back to that move in oil prices on Monday, which are under slight pressure coming into the Tuesday trading session.
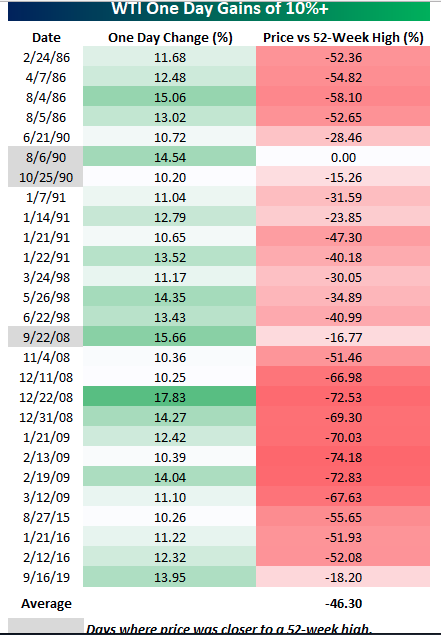
The table below (Bespoke Investment Group) shows every one day gain of 10%+ in WTI going back to 1983, and for each day we have also shown how far crude oil was trading from its 52-week high after the one day gain of 10%+.In the case of today’s gain, WTI prices are still more than 18% below their 52-week high, and while that may sound like a lot, there have only been three other days of the 26 prior ones shown where crude oil rallied more than 10% and finished the day closer to a 52-week high than it did today (gray shaded dates).In fact, of all the days listed below, the average spread between WTI’s closing price on the day of the big gain and its 52-week high was over 46%! Talk about being in the hole!
With the S&P 500 losing ground on fear over how long it might take for Saudi Arabia to recapture production that has been lost, investors want to know what they might expect from the equity market as crude oil rises in the manner it did Monday. History shows that past episodes, albeit with some notable exceptions, haven’t caused much harm to stocks. While the day of the crude oil price shock is usually met with an equity market drawdown, the out months prove favorable.
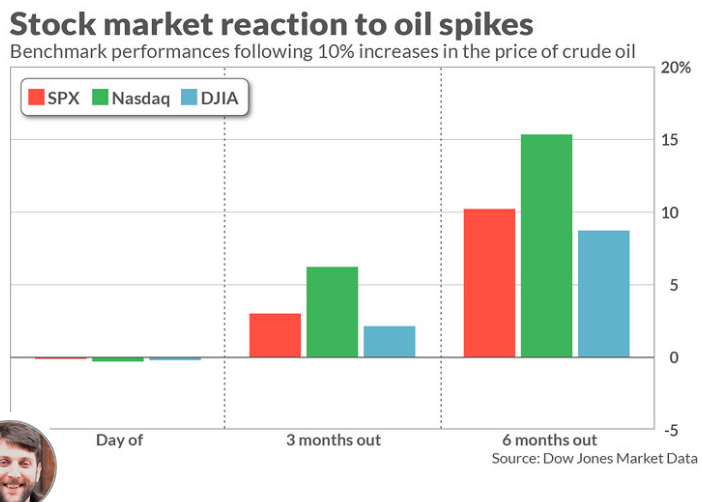
The S&P 500, on average, rose 10.2% in the six months following one-day, crude-oil price spikes of 10% or more, nearly 4 percentage points higher than the 6.3% average growth of the S&P 500 during other periods. The Dow has risen 8.7% six months after a 10% crude surge, versus a typical 6.1% rise, while the Nasdaq has seen a 15.5% rise compared with a typical 8.2% ascent.
“The attack in Saudi Arabia is something to watch, but it doesn’t look like a major problem,” said Sam Stovall, investment strategist at CFRA. “The U.S. said it would open up the strategic reserves, and the Saudis have redundancies, and as a result the effects should be offset somewhat.”
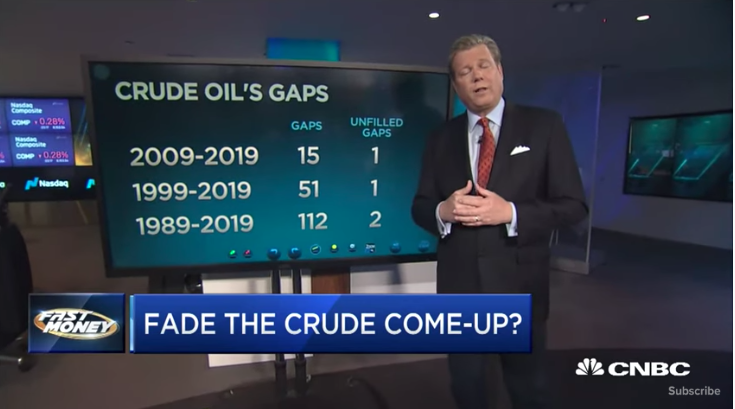
Cornerstone Macro’s cheif technical analyst Carter Worth identified reasons investors should fade the rally in crude oil on CNBC’s Fast Money last night. Carter identifies the gap in the chart for crude oil futures that would need to be filled to the downside.
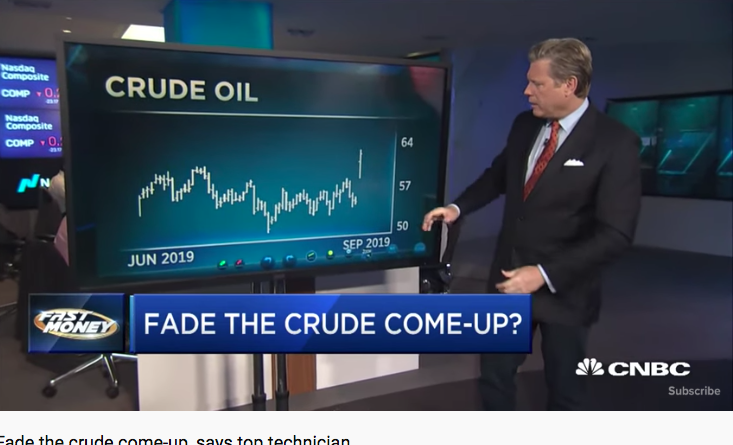
Carter Worth forecasts the gap to be filled sooner than later and is too small to statistically not be filled. Worth also denotes only a few gaps that never got filled in the past. Keep in mind, Worth is having a rough year with his forecasts for some of the other major asset classes, including the S&P 500.
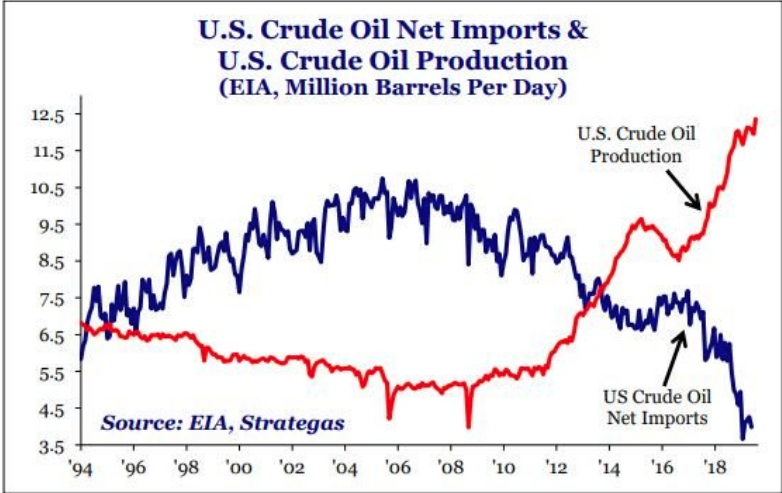
Regardless of Worth’s latest track record or shortcomings regarding his other forecasts, Finom Group is of the opinion that there will be some retracing of the recent oil ascent. Simply put, there is no shortfall when it comes to crude oil supplies and/or stockpiles, there is only a slowdown in production. More importantly is the increased self reliance on crude oil that the U.S. has undertaken in the last decade. The Saudi drone strike could be the largest oil disruption loss in history. Supply shocks have historically been associated with recessions. However, since the U.S. has ratcheted up oil production and reduced its reliance on imports, shocks are less impactful to the United States.
Combining some of the more pressing issues in the market for September, which is seasonally a weak month for equities, we can’t help but to marvel at the unwind of some of the more popular trades. Short oil, long bonds, long momentum and short value had been all the rage in 2019. In September, the reverse is in force and having been stimulated by sector rotation and a sell-off in the bond market. When will the unwind of these overcrowded trades come to an end remains to be seen, but here is what J.P. Morgan’s quant team reminds investors about and with some nostalgia (Volmageddon).
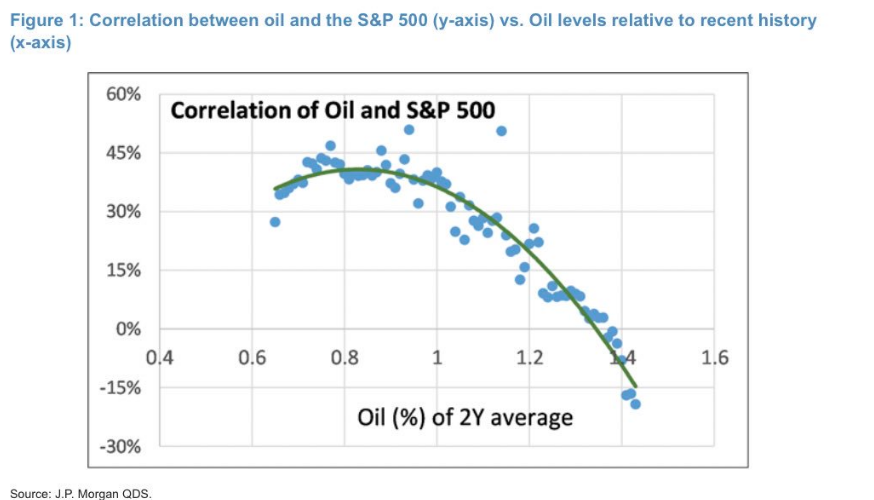
JPM’s head quant analyst Marko Kolanovic also denotes that even with the recent crude oil spike and unwinding of the short energy positions, investors really need not worry. “Figure 1 below implies that we could start expecting a negative impact from Oil on the S&P 500 in an $80-$85 range for WTI. This is still far away from the current level of $60.”
Morgan Stanley’s chief market strategist, Mike Wilson, isn’t as nostalgic as J.P. Morgan’s quant team, however, and believes the rotation and unwind of these overcrowded trades will lead to something far more demonstrative.
- The last two times the market has experienced a momentum breakdown this severe, it preceded or coincided with an economic recession (see below). He believes the recent breakdown in momentum signals the end of Goldilocks at best, and a recession at worst… but that both outcomes suggest the big winners this year are likely to come under further pressure. If the porridge is too cold, he believes the secular growth part of the long momentum strategy is more at risk than the defensives. He doesn’t believe momentum weakness will lead to a healthy or smooth rotation from growth to value because such a rotation will create too much portfolio destruction for most active managers and force a de-grossing of risk.
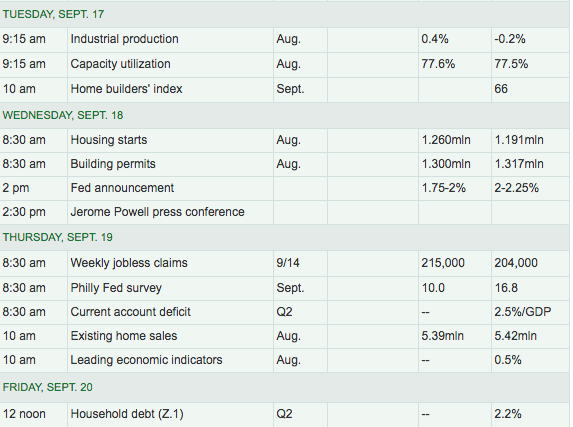
Moving beyond Monday’s crude oil headlines and speculations, investors will now focus on the economic data of the week and the FOMC 2-day meeting that kicks-off Tuesday. The event will end with a likely 25 bps rate cut on Wednesday and the subsequent press conference that follows the announcement. The risk to the market is not likely the rate cut itself, but rather the forward looking statements, dot plot and number of detractors. Two members opposed the last rate cut, and even more could oppose this one, based on certain of the economic data that has been delivered since the July FOMC meeting. Some strategists haves said the more dissents, the more it would add to increased market volatility, since the Fed outlook becomes much more uncertain if Fed officials are not more uniformly supporting policy actions.
The dot plot is where most market participants will head once the statement’s are released. If the dot plot doesn’t project more easing, the task might fall to Fed chairman Jerome Powell to leave the door open for another cut when he talks to reporters.
The market desires that the Fed remains carefully watching not just the U.S. economic data, but the global economic data, which continues to weaken. Additionally, the market desires that the Fed expresses it’s willingness to ease further, should the data deteriorate further in the coming months. Investors have reduced their expectations for future rate cuts to include just one more in 2019, December. Nonetheless, the Fed will need to at least express its willingness to act with more accommodation should the economic situation demand it.
At present, we believe that the Fed, led by Chairman Jerome Powell, has ample room to navigate the upcoming rate announcement and press conference, especially after the geopolitical event this weekend. The 3 main risks to the Fed’s outlook and global activity are as follows:
- Global economic slowdown
- Trade policy uncertainty
- Low inflation
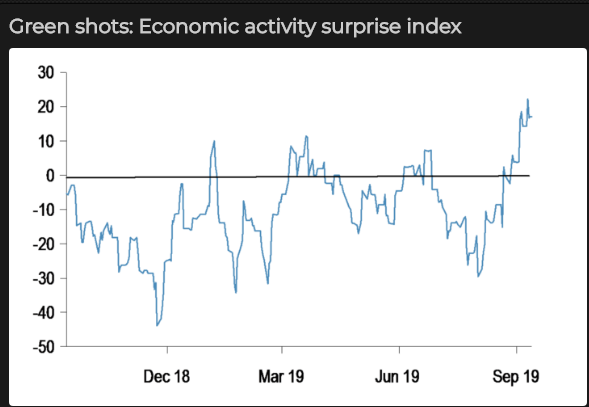
Pushing the Fed aside, if not at least for the day… there will certainly be enough time to worry about the Fed come Wednesday. The economic data has been coming in stronger than expected of late. This has pushed the Citi Economic Surprise Index higher of late. J.P. Morgan’s proprietary Economic Surprise Index has recently outperformed as well. The index had spent most of the year in negative territory before a stretch of positive service sector, jobless claims, retail sales and consumer spending data.
The notable manufacturing decline doesn’t portend as negative for the U.S. economy as it does for other industrialized nations. The U.S. economy has been less reliant on manufacturing since the 1970s. The service sector has grown to become the greatest part of the U.S. economy, setting itself apart from the Eurozone and China.
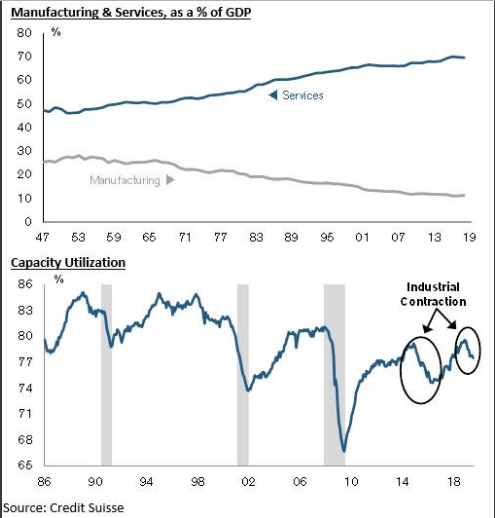
The contraction in ISM manufacturing data previously witnessed in 2015 wasn’t significant enough to drive a recession in the United States. Given the relatively small weight of manufacturing in the U.S. economy, it must decline substantially to drive a recession. Current conditions appear similar to the 2015 contraction but above levels typically experienced going into recession.
With some of the focus on manufacturing data this week, the latest regional data is expected to weaken and has. The Empire State business conditions index fell 2.8 points to 2 in September, the New York Fed said Monday. Economists had expected little change and a reading of 4.9, according to a survey by Econoday.
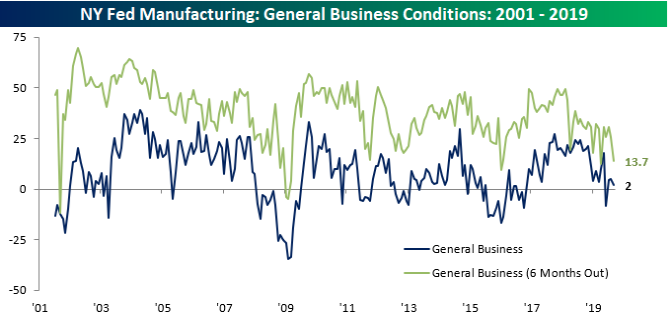
The index of present General Business conditions only fell slightly and expectations for the next six months were notably weaker, falling from 25.7 down to 13.7. While both of these indices are well off their highs from the last year or two, they also aren’t at levels that, at this point, would be considered dangerous for the economy.
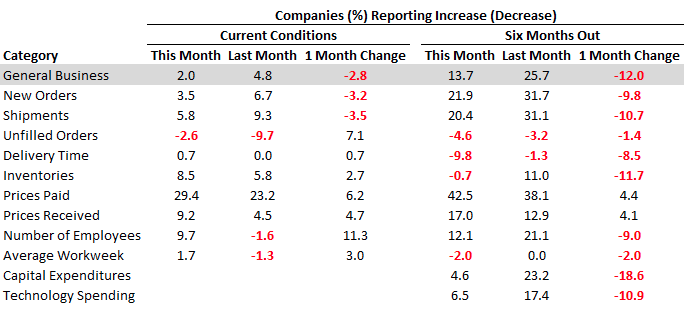
One notable aspect of the Empire State survey was the large drops in expectations for Capital Expenditures and Technology Spending. The index that tracks plans for Technology spending fell 10.9 points from 17.4 down to 6.5 in what was the largest monthly drop since May 2016. Plans for Capital Expenditures were even worse as that index fell 18.6 points from 23.2 down to 4.6. For that index, it was the third-largest decline in the report’s history dating back to 2001 and the largest monthly decline since May 2016.
Here again, though, while these declines are pretty steep, they aren’t at levels that in the past have been considered recessionary. And today’s economic data releases aren’t terribly meaningful historically, as investors look forward and toward tomorrow’s FOMC meeting.
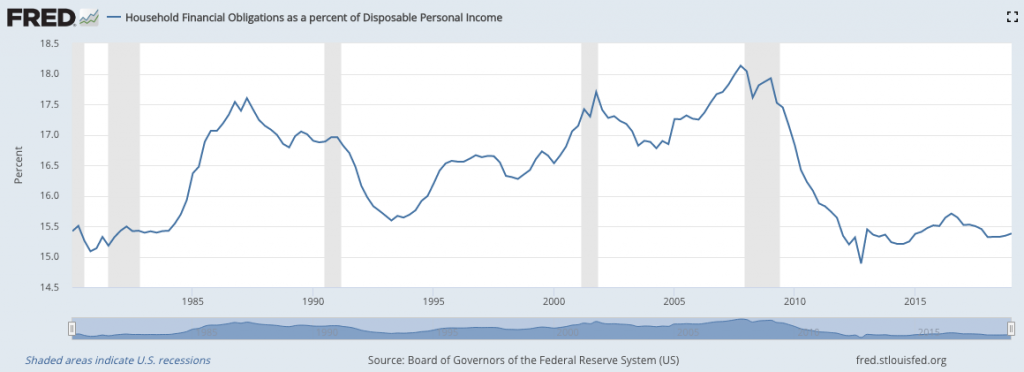
As noted earlier, the service sector aimed at servicing consumers has remained healthy in the face of weakening manufacturing output. The consumer has been benefitting from wage gains and a robust labor market. Household financial obligations remain at some 45+ year lows when juxtaposed with disposable income levels.
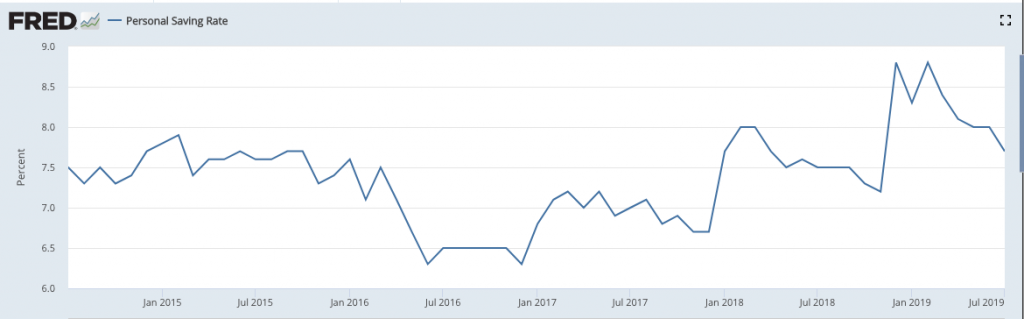
August monthly retail sales confirmed for investors that despite all the talks of a recession and waning consumer sentiment surveys, the consumer remained in spend-mode. We might have expected this from the recent update from the Personal Income and Expenditures (PCE) data that pointed in a significant decline in the Personal Savings Rate, the first significant decline of 2019.
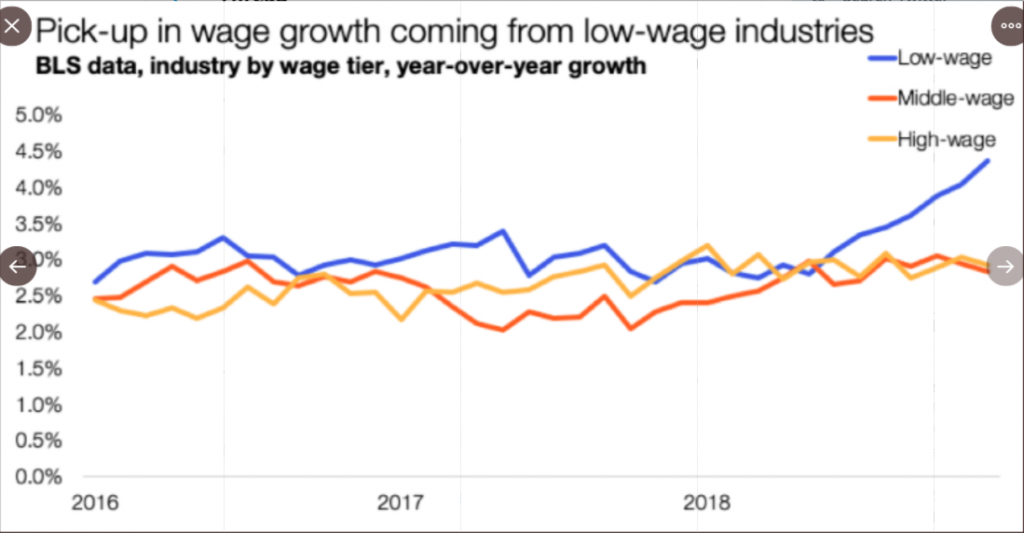
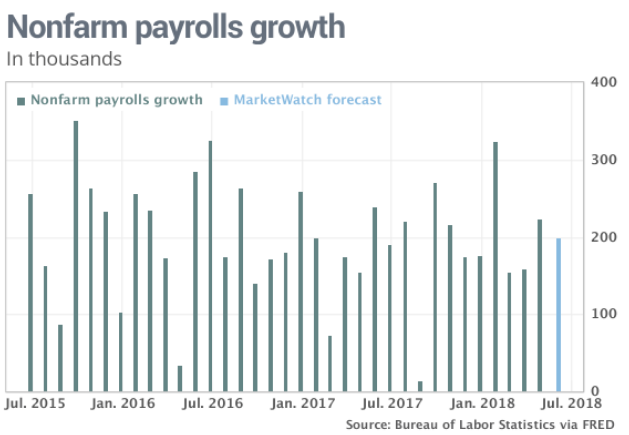
What may be proving of greater importance in the consumer spending equation in 2019 than in years past is the acceleration in wage growth amongst the low-wage bracket. As we can see from the BLS Nonfarm Payroll data chart below, low wage earners have experienced the most significant pick-up in wages in years and when compared to peer wage tiers.
When we consider the drop in the Personal Savings rate since mid 2019, we are forced to recognize that low-wage earners are not typically “savers”. With this in mind, it is no wonder the Personal Savings rate has dropped as low-wage growth has accelerated to the upside and has found retail sales also accelerating since mid-year.
Despite economic uncertainty, households increased their spending at a 4.7% annual rate in the second quarter, the strongest pace in four and a half years. WSJ’s Gunjan Banerji looks at why the consumer is powering forward, and whether it could be enough to prop up the economy, in this latest video analysis of the consumer. Gunjan outlines that despite several headwinds, the consumer has outperformed fears of an economic slowdown.
And to accompany or coincide with Gunjan’s analysis of the consumer and wage growth benefits adding to consumer spending, holiday sales are expected to show YoY growth once again. Holiday retail sales for 2019 are forecast to increase 4.5% to 5%, exceeding $1.1 trillion, according to an annual survey by Deloitte. That would be better than the Census Bureau data of sales growth of 3.1% on sales of $1.09 trillion from last November to January.
“I think this will be a surprise for our clients,” said Rod Sides, vice chairman of Deloitte’s retail and distribution practice in the U.S. “I think most [retailers] would expect a slightly lower increase. … This is probably bigger than those expectations.”
Sides denotes some key positive factors that will push holiday sales higher in 2019:
- 2019 holiday season laps a season last year during which the U.S. government shut down and the stock market saw major declines last December. “We’re [coming] off a much lower base. … But we don’t expect [those things] to happen this holiday season.”
- The U.S. labor market remains strong.
- Unemployment rates still near record lows.
- Consumer confidence elevated.
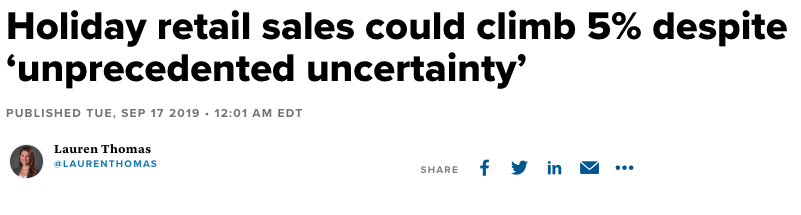
A separate forecast by global consulting firm AlixPartners is calling for holiday sales growth of 4.4% to 5.3 percent. But AlixPartners says there’s still “unprecedented uncertainty” as the season approaches.
“While our forecast is bullish, we are nevertheless advising clients to be nimble,” said Joel Bines, a managing director for AlixPartners. “These are uncharted waters, and the best course to set is one that includes a strong cost control and flawless execution.”
As the economy muddles through the Q3 period, which will come to an end this month, we also anniversary the annual recession call from the infamous pseudo-economist David Rosenberg. It was in June of 2018 that Rosenberg made his previous recession forecast.
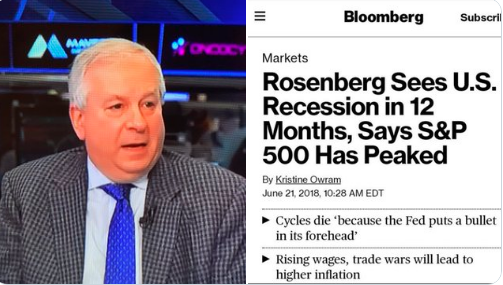
While we can recognize the growth slowdown in 2019 and from tough comparisons, fueled by tax reform legislation and now refuted by a year-long trade war, Finom Group doesn’t see the necessary components for an imminent recession.
Equity futures and crude oil are setting up for a negative open for trading on Wall Street Tuesday, but noted market bull Tony Dwyer of Canaccord Genuity suggests investors should get aggressive with their equity exposure near-term.
On CNBC’s Fast Money, Monday evening, Dwyer laid out his case that history suggests a continuation of the market move higher into 2020.
- Sentiment got bearish enough with 10-year yield low enough
- 2011-2012: Fears of Greece to be knocked out of Euro and Euro to break up.
- Stock market bottomed that year at -19.6%. Then S&P 500 rallied 22% and from their the market rallied another 38% until the 10 year rallied to over 3%.
- 10-year likely made a low. Will likely go back to 2.5% over time.
- We’ve had 3 mini recession fears already, driven by global industrial output.
- ECB disappointed in their action last week, but their commentary on inflation is what drove rates in the market. They got ahead of the curve not by cutting but by their commentary.
- The Fed Funds Rate gets the S&P 500 to breakout, assuming it is not the highest level rate, which it is presently.

Dwyer believes investors should be playing offense by getting into the cyclicals, financials, tech and consumer discretionary. Again, the caveat is that the Fed has to get ahead of the curve by lowering rates or convincing the market to lift the long-end of the curve.
Rounding out today’s daily market dispatch, Finom Group offers this “Public Service Announcement” of sorts: Beware of social media pundits masquerading as economists, certified market technicians and strategists. With all the headlines surrounding the spike in crude oil and gas prices to come over the weekend, Twitter participants were out and about with false and misleading narratives. Here is one example of such a false narrative:
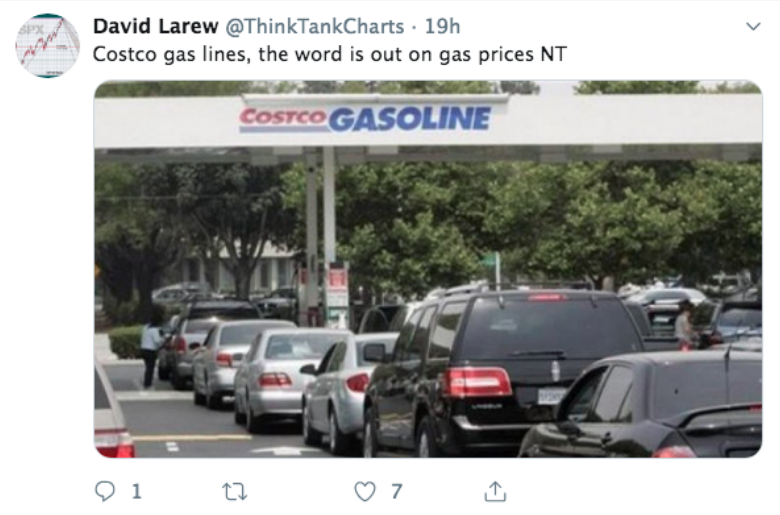
With over 11,700 followers, this twitter account thought it was necessary to frighten investors and market participants into believing there was some kind of run on the gas pumps, given the likely event of rising gas prices from the oil field bombings. A quick analytical dive into the photograph revealed the photo first appeared in a 2012 article here (link).
Folks, things have to get a whole lot worse for oil and gas prices to produce such panic amongst consumers. This was also recently pointed out by Nick Cola’s, co-founder of DataTrek Research, who says the spike in oil is likely “unsustainable.”
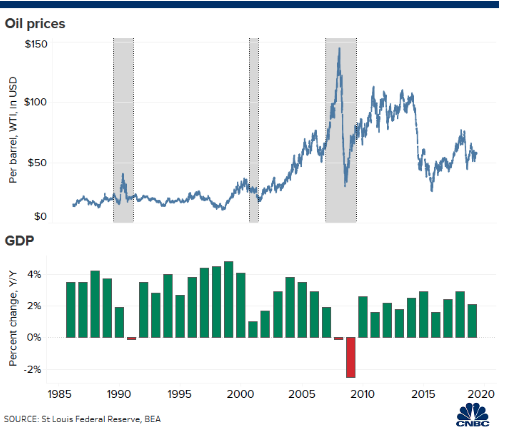
Even the $80 level might not mean a pronounced broader downturn for the economy. Colas points out that of the recessions the U.S. has seen dating back to the early 1980s, none has come without an oil spike of at least 90%. The Great Recession, for instance, saw a 96% move, while the dot-com bust featured a 141% surge and 1990′s was preceded by a 96% jump.


