Research Report Excerpt #1
Which sector will lead the longer-term trend? Sector and style rotation has remained a dominant theme in 2021, but investors shouldn’t get too bogged down by this debate, missing the forest for the trees. It’s this constant style and sector rotation, this leadership and laggard-ship that may be making it that much more difficult to evoke a greater correction/consolidation period. The fact remains that a rising tide is lifting all boats longer-term. I think the best way to visualize this is in the following 35-day chart of sector performance.

We’ve definitely seen a shift since late February/March in sector performance. What had been working was the reopening trade/cyclicals/value, but what has taken over leadership since has been defensive and that which was lagging, Staples, Utilities, Health Care and Real Estate. Nonetheless, most everything still delivered positive returns over this time period, shy of Energy. The main point is to pick good stocks, recognize that sector rotations are likely to continue, but know that if the fundamentals of the stock are strong while the stock’s sector is underperforming, eventually the laggards will come back to life in a bull market.
Research Report Excerpt #2
There are some key seasonal and analogue-type collisions occurring into May that investors should heed. The consideration, in my opinion, is one that fashions GAME PLANNING. Let’s first look at our trusted (to-date) 2009/2010 – 2020/2021 S&P 500 analogue.

At the end of this past trading week, the S&P 500 was ~9% above where it is indicated in 2010. In the coming weeks, the S&P 500 embarked upon the initial leg of its major price consolidation, which was set-off by the May 6th Flash Crash in 2010. While mechanisms were put into place post the 2010 Flash Crash to avoid such an occurrence in the future, it’s still incumbent upon investors to recognize current valuations and price will likely prove very sensitive going forward and through the analogue’s offered corrective period. I think this sentiment was proven this past week on Thursday, and when the Biden tax proposal plans were leaked out by the media.
Research Report Excerpt #3


Research Report Excerpt #4


Research Report Excerpt #5
The blended earnings growth rate for the first quarter is 33.8% today, compared to an earnings growth rate of 30.3% last week and an earnings growth rate of 23.8% at the end of the first quarter (March 31).
Insight/2021/04.2021/04.23.2021_EI/S%26P%20500%20Earnings%20Growth%20Q1%202021.png?width=920&name=S%26P%20500%20Earnings%20Growth%20Q1%202021.png)
If 33.8% is the actual growth rate for the quarter, it will mark the highest year-over-year earnings growth reported by the index since Q3 2010 (34.0%), according to FactSet data. Looking at future quarters, analysts project double-digit earnings growth for the remaining three quarters of 2021, with earnings growth expected to peak in Q2 2021 at 55.4 percent.
During the upcoming week, 181 S&P 500 companies (including 10 Dow 30 components) are scheduled to report results for the first quarter.

Research Report Excerpt #6
“Quiet periods are the perfect time to strengthen your mental game. A lot of investing is about controlling your emotions and biases, believe it or not. And let’s face it: Hubris seems to be at an all-time high these days, along with prices in most markets.
This week, we’ll look at the Dunning-Kruger Effect and how an imbalance of competency to confidence could sabotage your investing success.”

The Dunning-Kruger Effect is a cognitive bias in which people overestimate their competency and underestimate other catalysts, such as luck, for an outcome.
There’s a relationship between competency and confidence, too. A little knowledge can lead to a lot of confidence until you realize how much you don’t know about a certain subject.
Research Report Excerpt #7
The course over the last 13 months has been upward sloping, with the S&P 500 growing over 85% from the March 2020 lows. Good, bad… what does the data suggest?

The 85% runs higher after prior bear markets (declines of at least -20%), don’t generally favor the bulls. Looking at some of the dates noted, however, none register the breadth readings we’ve outlined in this week’s or past Research Reports.
Research Report Excerpt #8
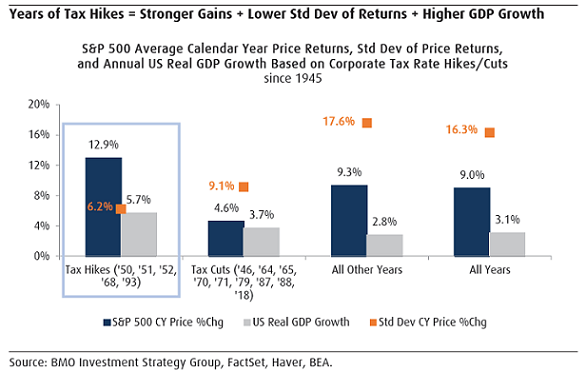
The below chart from BMO Investment Strategy Group shows the performance of the S&P 500 Index during periods taxes were either raised or lowered since 1945. In the years of tax increases, the S&P 500 Index generated better returns versus years in which tax cuts were instituted. Additionally, GDP growth was stronger in the years where tax hikes were instituted as well.

Research Report Excerpt #9
Something I remind myself of often is that my mistakes or misgivings as a strategist, investor and analyst are no greater than anybody elses mistakes. As we often look to breadth to validate price action, an example of this sentiment I offer takes us back to April 2020.
“Sharp declines in market breadth in the past have often signaled large market drawdowns,”Goldman Sach’s David Kostin wrote. “Narrow breadth can last for extended periods, but past episodes have signaled below-average market returns and eventual momentum reversals.”


