It has already proven a rather choppy start to the trading week, with the S&P 500 (SPX) rallying on Monday and the Nasdaq (NDX) bouncing sharply. On Tuesday, however, all major averages gave up ground as investors grappled with commentary from legislators. Heading into the Wednesday trading session, investors/traders will likely be watching Congressional testimony from the big technology firms as they attempt to answer questions regarding monopolistic and/or antitrust business practices.
The technical picture surrounding the S&P 500 remains relatively healthy. The benchmark index remains above its more near-term, faster 20-DMA. The 50-DMA comes into view at roughly 3,118 and the 200-DMA has been steadily climbing higher over the last month and comes in at 3,044.
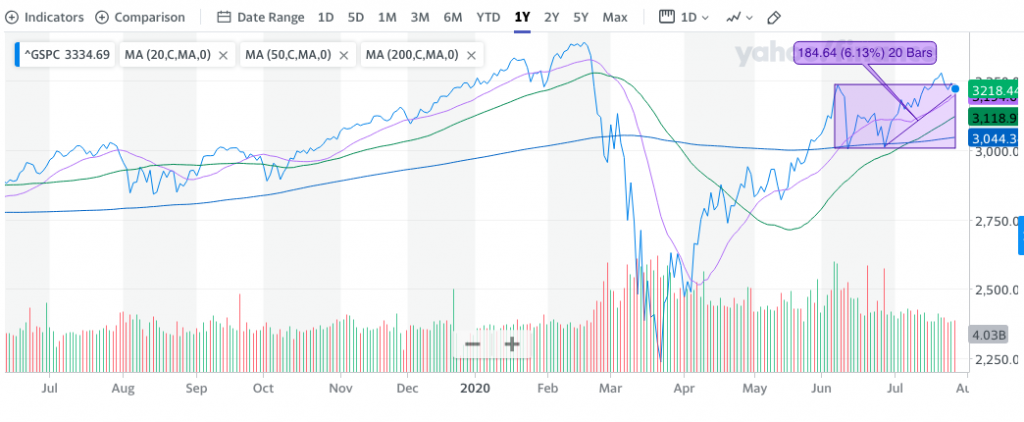
What’s most important in the chart above is the fact that the aforementioned moving averages are all sloping up, indicating the uptrend since the consolidation period that commenced on June 10th is one that has been met with an upward bias. After recently breaking out of the consolidation zone (purple rectangle) and to a post bear market high of 3,277, the benchmark index has revisited the consolidation zone, which some might characterize as a “false breakout”. The negative connotation of a false breakout is dubious and inconsequential until proven otherwise.
Moreover, the current consolidation comes at a time when the technicals have highlighted overbought conditions.
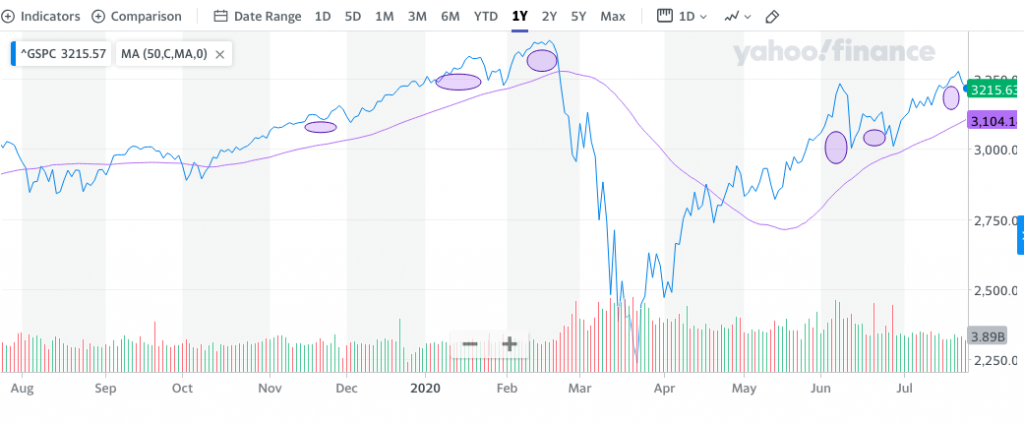
In the S&P 500 chart above, we recognize that in recent trading days the S&P 500 has extended some 2 std. deviations above its 50-DMA. While it has reached beyond such heights in the past, it usually consolidates such frothiness under these conditions and before moving higher. Any number of headlines would likely be attached to such consolidation when it appears, but the reality is that investors/traders are found with a consistent pattern of locking-in their profits when markets become stretched.
One such excuse attached to the pullback in equities on Tuesday was the commentary from Senate Majority Leader Mitch McConnell. Senator McConnell said Tuesday that he will not pass a coronavirus relief bill in the Senate which does not include liability shields.
“We’re not negotiating over liability protection,” he told CNBC’s Kayla Tausche as Congress looks to craft a pandemic rescue agreement. He noted, however, that the GOP is open to compromise on other issues.
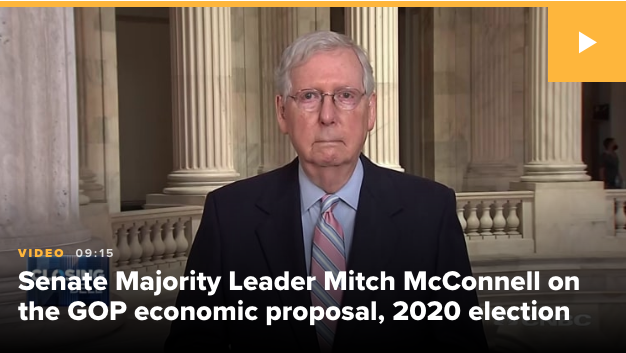
Democrats have generally opposed the legal shield because it could take away a recourse for workers who return to an unsafe workplace as the pandemic spreads around the country. McConnell contended “there’s no chance of the country getting back to normal without it.”
In a joint statement Tuesday, Pelosi and Schumer said that “catastrophe is looming, and until Senate Republicans get serious, they must answer to every hungry child, every family that cannot make rent, every worker being denied their UI for their delays.”
“Democrats remain ready to work with Republicans on real solutions to bring immediate relief and save lives and livelihoods,” they said.
The rigidity of the statements surrounding negotiations for what is now being called the Heals Act, found an adverse reaction from equity markets and a flight into the bond market, as yields fell further on the day.
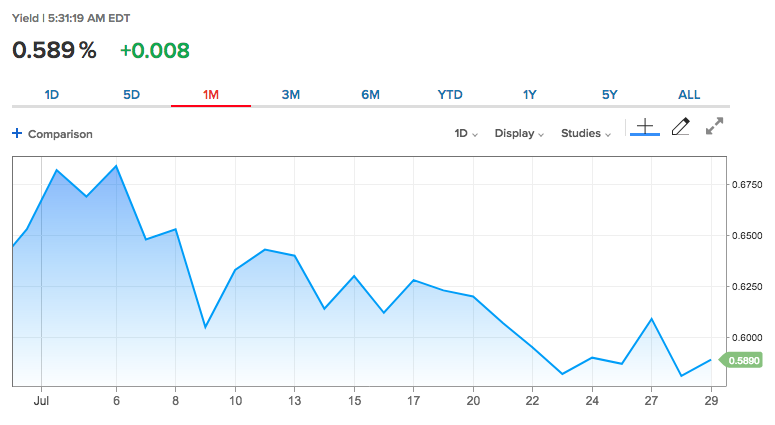
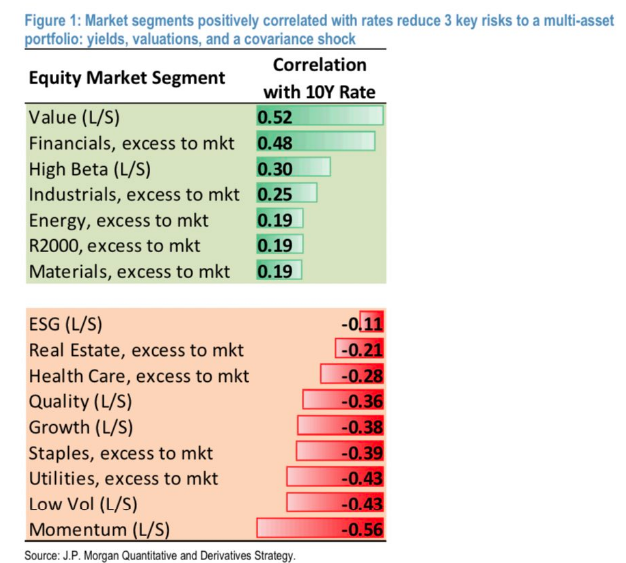
The 10-year Treasury yield has remained under consistent pressure over the last month, if not longer, as Quantitative Easing measures, uncertainty surrounding the global economic recovery and the appetite for risk free premium is hard to resist as investors still seek diversification. The varied reasons for lower yields while equities have continued to rally to new highs was a subject for consideration by J.P. Morgan analysts recently. The firm offered the following:
- JPM: The era of bonds/equities rallying together “may be coming to an end, posing a significant risk to multi-asset portfolios.. Can one still generate returns and.. hedge the risk related to.. rates and inflation? Yes.. by adding stocks.. that have more negative correlation.”
The fact of the matter remains that bond yields will always have a zero-bound trajectory. U.S. yields are no different than sovereign debt yields around the world. Even with yields this low and the market basically flat on the year, the equity risk premium (ERP) entices investors to go further out onto the risk curve by purchasing equities/equity ETFs. The ERP is not as juicy as it was in late March through May, but it remains elevated.
With the aforementioned ERP in focus, we recognize that forward multiples are also more expensive than they have been over the last decade plus.
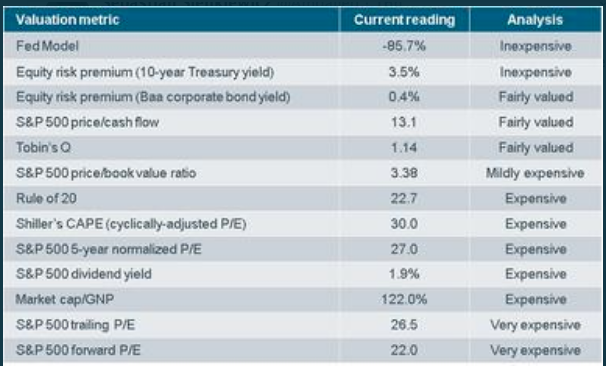
In the table above we can discern that ERP is elevated, but not expensive while the S&P 500 forward P/E is 22, definitively expensive.
- The forward 12-month P/E ratio for the S&P 500 is 22. This P/E ratio is above the 5-year average (17.0) and above the 10-year average (15.3).
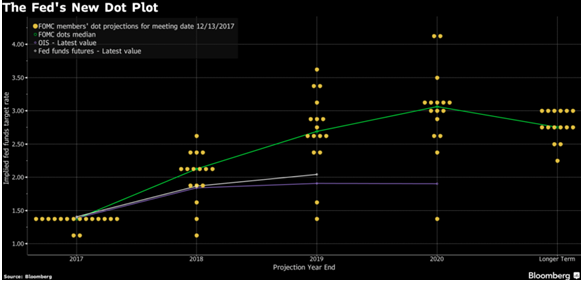
It’s important to recognize, however, that “expensive” is a relative term and/or dependent on where investors can find the greatest yield over the next 1, 2, and 3 year periods. Presently, and with a Fed that is unlikely to raise rates EVER AGAIN, stocks are likely to remain where the greatest long-term yield can be found. The potential for the 5-year and 10-year trailing PE ratio for the S&P 500 to travel higher over the next decade becomes recognizably a likelihood given all the aforementioned details. I would be of the opinion that the 5-year PE average will climb to between 18.5-20 and the 10-year PE may average 22-24. Simply put, if bond yields prove zero-bound and rate hikes are not implemented, the ERP and S&P 500 dividend will prove more favorable over time, expanding P/E ratios. And speaking of dividends…
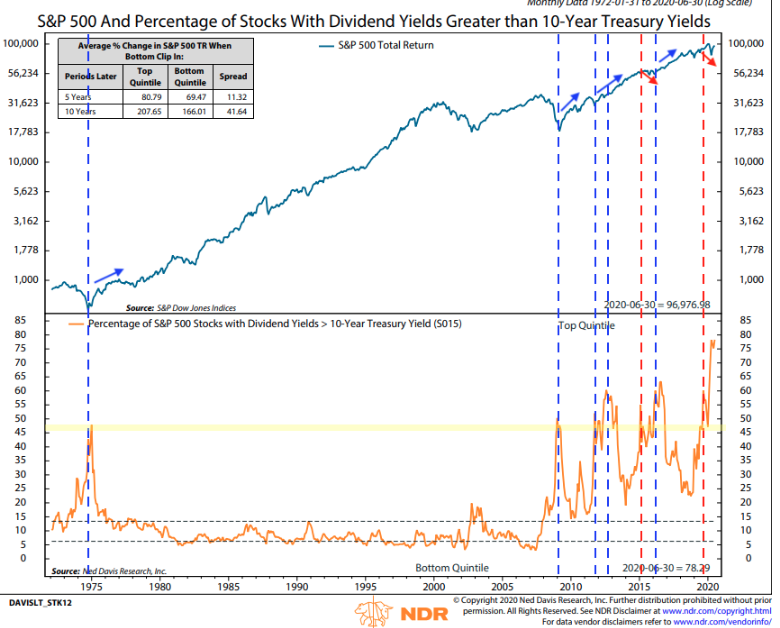
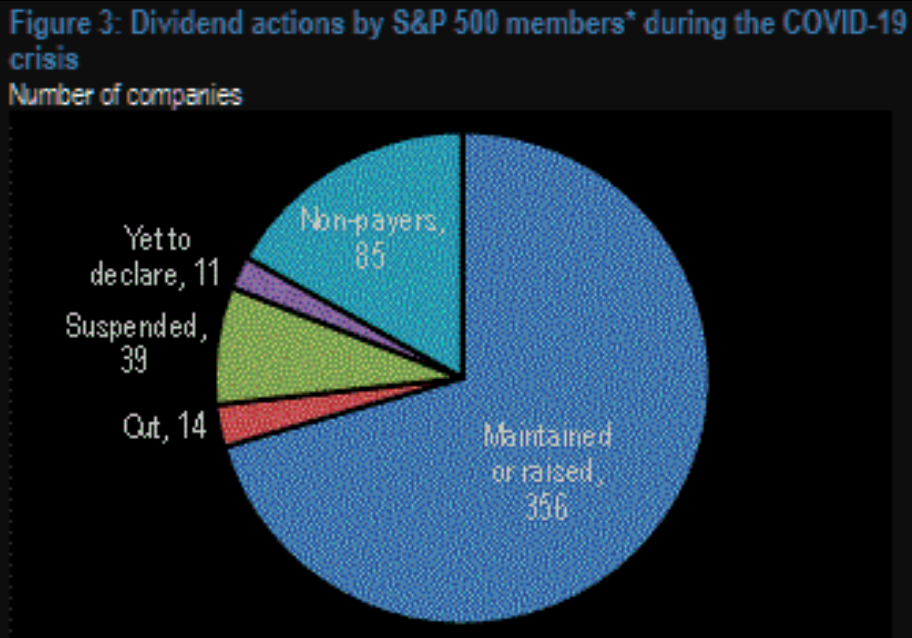
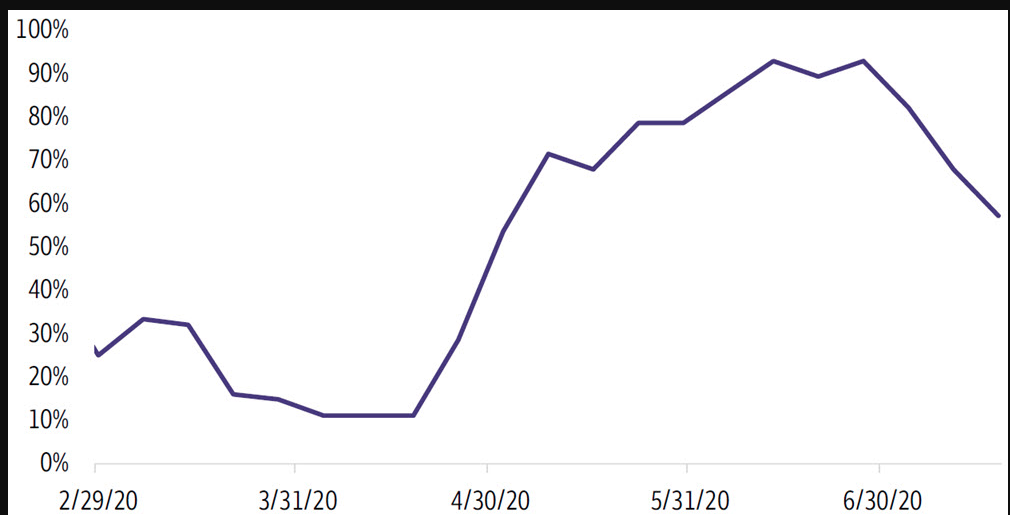
As shown in the Ned Davis Research chart above, more stocks than ever have a yield greater than 10-year Treasury notes. While dividends have been cut in 2020, given cash flow issues related to the pandemic economic shutdown, they have not been cut to the extent the 10-year Treasury has fallen consistently over time. In fact, while many had forecasted significant dividend cuts by S&P 500 members, very few have done so. (See pie chart below)
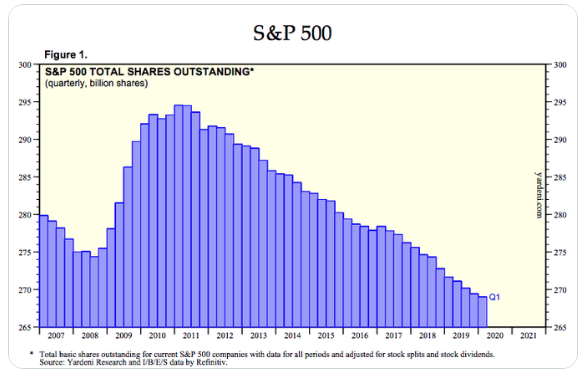
There are many reasons to be long-term bullish on equity markets that prove unrelated to the earnings profile and forecasts from one quarter to the next, and we hadn’t even discussed market structure 😉 ! Least we not forget that there are fewer and fewer stocks to buy with each passing year. Ergo, there are more dollars chasing less supply.
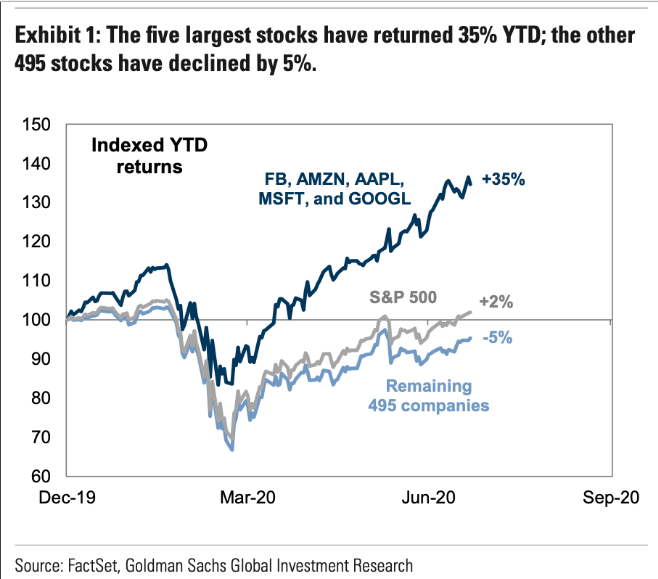
Over the next 48 hours, earnings will continue to move individual stocks, but come Thursday and after the closing bell and after congressional testimony and after the Fed rate announcement an after the Fed Chairman press conference on Wednesday, the Big 4 reports will be delivered. We could move from an environment where individual stocks move on earnings results to an entire market place moving on the Big 4 reports Thursday. In the next 48 hrs, FOMC meeting and 40% of the NDX reports by way of Alphabet (GOOGL), Amazon (AMZN), Apple (AAPL) and Facebook (FB).
With the S&P 500 stuck in a 2-month range, we’re likely to see a break below 3,100 or a break above 3,280, depending on the reactions to the Big 4 reports. What I’ve previously outlined regarding “Super Thursday”, to Finom Group members, is to simply monitor the market’s overall response to the Big 4 reports. Hedging ahead of such significant market-drivers is a gamble of sorts. The market has an upward bias and while these 4 stocks can easily be recognized as expensive, their earnings power is undeniable. Moreover, they’ve even proven to be safe haven assets during the pandemic crisis, given their consistent cash flows, on-trend business models, and strong balance sheets that enable these companies to whether such storms in the economy. Long-term, these 4 business models are solid and it would be more on-trend for investors to simply buy any weakness, should it come to pass, than to speculate with hedges. Discipline matters!
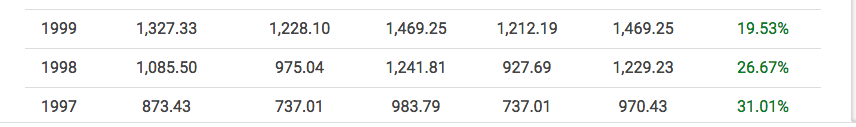
The final trading days of July are here folks! Nobody expected the first 7 months of the trading year to play out the way they did. Most analysts and strategists were optimistic on S&P 500 returns in 2020, especially given the historical data that outlines market strength that begets more strength… and 2019 produced strength. In the post-World War II, the S&P 500 has never generated a negative return the year after gaining 30% or better.
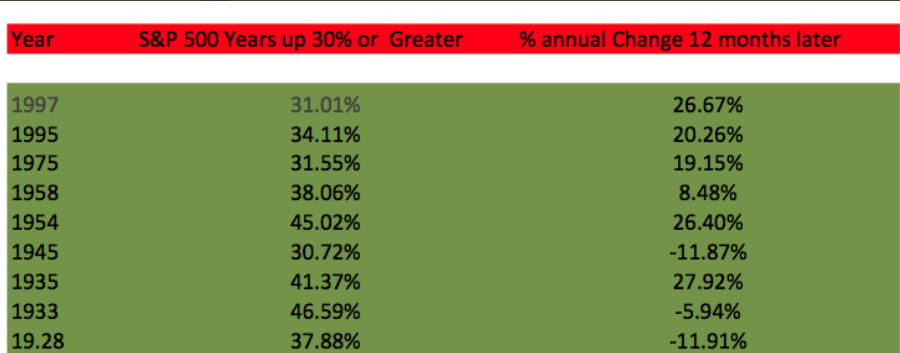
Prior to 2019, the last time the S&P 500 gained 30% or better was in 1997. The gains in 1997 were followed by a 25%+ gain in 1998 and a 19%+ gain in 1999. We seem to always find narratives with negative connotations dating back to the dot-com era boom and bust cycle, but we also seem to forget it was a multi-year period whereby valuations increased remarkably. So if you think the Nasdaq 100 is too pricey today, after a 4-month long rally… well it’s only been 4 months folks.
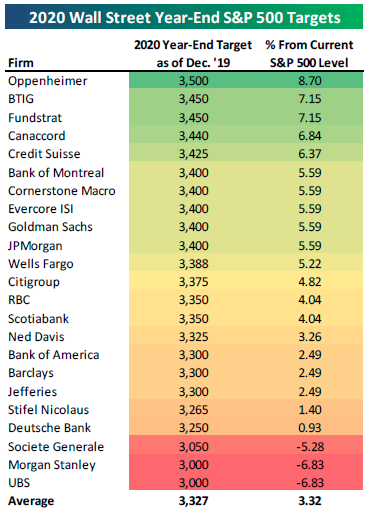
These were the year-end S&P 500 price targets at the start of 2020. The average target is about 90 points higher than the S&P 500’s current level. Wonder what it would have been had they had a crystal ball looking 3 months forward at the time?
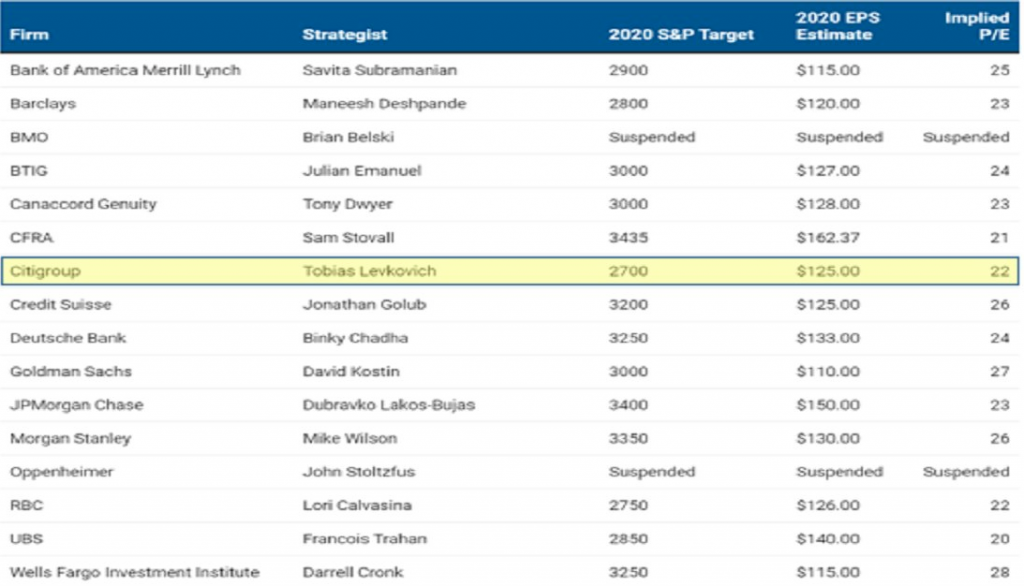
Some of these price targets have changed recently. Citigroup’s Tobias Levkovic lowered his PT to 2,700 post the March bear market, but has since raised it to 2,900. Canaccord Genuity’s Tony Dwyer removed his 3,440 PT in March and recently reinstated a new PT for year-end 2020 of 3,300. The below table reflects some of the latest PT offerings.
It has already been a tumultuous year for investors and the global economy. Getting a vaccine for COVID-19 will help to normalize life thereafter. U.S. drug maker Pfizer (PFE) and German biotech BioNTech said they began their late-stage human trial for a potential coronavirus vaccine on Monday.
The trial will include up to 30,000 participants between the ages of 18 and 85 across 120 sites globally, including 39 U.S. states, the companies announced. If it is successful, they expect to submit it for final regulatory review as early as October. They plan to supply up to 100 million doses by the end of 2020 and approximately 1.3 billion doses by the end of 2021.
October seems a long ways away in the moment. For now, we’re heading contending with the final trading week of July, and with what has proven to be a historically negative month of returns for the month of August ahead. But wait…

As shown in the LPL table above, August is usually a negative month for the S&P 500 going back to 1950… except during ELECTION YEARS! We’ll see if history repeats itself again this election cycle, but this is why we deep dive and gather as much historical data points as possible. If you don’t have the right inputs/variables, you’ll likely not have the more accurate outcomes/probabilities or expectations.
With an election year comes a host of other questions and considerations. Most polls show the challenger, Joe Biden, outpacing the incumbent President Donald Trump. Based on the latest polling data, there’s growing consensus that Democrats may also possibly sweep Congress. Some might think this could be a negative for stocks, as a higher corporate tax rate that reduces earnings could be part of the Democratic platform. As shown in the LPL Chart of the Day, the S&P 500 Index has been higher 9 of the past 10 times and 15 of the past 18 times Democrats controlled both the White House and Congress.

In looking ahead to the hotly contested election period, which begins in earnest in September, here is the latest analysis from Wells Fargo’s Paul Christopher, CFA, Head of Global Market Strategy: (Not a reflection of Finom Group’s thoughts or opinions pertaining to the election cycle)
Key takeaways
- Our base case now is that the Democrats will capture the White House and control both chambers of Congress in 2021.
- We believe some market-negative implications may be likely, but we also see potential counterbalancing implications. Most importantly, we believe that the most controversial campaign promises will not make it through Congress, due to economic and other constraints.
What it may mean for investors
- We favor planning for market turbulence into year-end and expect a probable recovery through 2021. Our preferred strategy includes a disciplined plan to de-emphasize U.S. small-cap equities, in preference for U.S. mid- and large-caps, as well as sectors that offer growth potential and strong balance sheets.
Why has our base case changed to a sweep by the Democrats?
In June, we projected a close race for the White House, but we now believe that former Vice President Biden has the better chance to be elected president in November. As part of this scenario, we also foresee that the Democrats may take a modest majority in the Senate and keep control of the House.
The odds could flip again to favor President Trump. Trump is an aggressive campaigner, and Biden is only partially tested as a presumptive nominee. It is not unusual to see polls tighten in the 100 days before an election. Finally, voter turnout amid the pandemic remains an unpredictable factor that may change the odds.
Nevertheless, it is our view the incumbent has an increasingly uphill fight. President Trump no longer enjoys stronger poll numbers than former Vice President Biden on managing the economy. Meanwhile, as COVID-19 infections increased nationally in July, Trump has trailed Biden by double digits in polls. We do not expect a reversal of these trends.
What about Trump voters who have not declared themselves?
A majority of Pennsylvanians surveyed in a recent Monmouth University poll suggested that many Trump backers decline to reveal their support. There are several caveats to this poll result. The first is that many such voters do not participate at all. Over 137 million voters went to the polls in 2016, but about 39% of eligible Americans did not vote. Many of these are working-class white voters, who have been Trump’s most reliable supporters. It is not clear that they will participate in 2020.
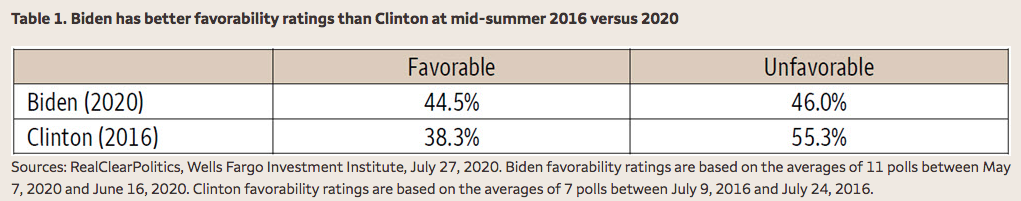
The second caveat is that many of these voters may break for Biden, including younger voters who have not always participated in past elections. An important difference between 2016 and 2020 is that Biden is less unpopular than Hillary Clinton was (Table 1). Meanwhile, Biden’s lead over Trump is not only wide but broadly so across polls. Even polls of likely voters, which tend to show a somewhat closer race, do not change the consistency of the story. In every swing state we have been watching, unemployment is rising, and Biden leads Trump.
Third, the top issues remain the economy and the pandemic, and both are trending away from Trump. High-frequency data show further loss of economic momentum. The chart shows that economic activity through July 24 is still expanding, but the number of indicators showing expansion is narrowing, coinciding with new infections disrupting the economy’s reopening.
Finally, Trump also faces the incumbent’s disadvantage that dissatisfied voters tend to blame the country’s problems on those in office. In a WSJ/NBC news poll in early July, 72% of respondents said that the country is heading in the wrong direction, up from 56% in March 2020.5 In sum, we expect that some people have not declared their voting intentions, but in our view, those plans will not make the difference for the incumbent.
Will a sweep by the Democrats change our investment approach?
It is difficult to predict the legislative priorities of the next Congress, but tax reform is likely near the top of the list. We anticipate the corporate tax rate is likely to rise from 21% to 28%, and the top individual rate to 39.6%. State and local tax (SALT) deduction caps are likely to be rescinded, but the income cap on Social Security liability could be raised. We believe the corporate tax increase could reduce 2021 S&P 500 Index earnings per share by up to 7% on our forecast for earnings per share, but the exact amount will depend on other provisions in any legislation. We expect the regulatory environment should return to what it was under the Obama administration.
Nevertheless, it will be important for investors to gauge the constraints on single-party government. First, if Congress only hikes taxes next year, the economic recovery will be at risk. We expect spending programs to potentially stimulate the economy and help to counterbalance tax hikes. Campaign promises until now indicate a wide variety of spending programs—health care, infrastructure, and income support programs just for starters.6 We believe the Democrats will have a net stimulate policy.
Another constraint on the Democrats will be that single-party government does not eliminate ideological differences that should complicate the passage of controversial issues. It seems the Democrats have a deep split between moderates and progressives. And we still expect a large Republican minority. We cannot know at this time how power will distribute among the three groups, but we expect that old adage to hold—namely, across groups with very different ideologies, the moderates typically hold the deciding votes. An ideological split within the Republican party in 2017 blocked most of the legislative agenda for six months, and market expectations priced in during that time were disappointed. So, we believe the most controversial issues are unlikely to become law, including the Green New Deal and Medicare for All.
What do we favor doing in portfolios now?
- Stay focused on the economic recovery.
Chart 1 illustrates that the economy is still growing. We have strong conviction that even a gradual recovery will support higher equity prices into the end of 2021, although there may be some range-trading into year-end 2020. - Remember that the U.S. system of government has many checks and balances.
It’s a fact that many Republican voters worried about their investments when President Obama was elected. Many Democrats similarly worried when President Trump was elected. Our system has historically worked against extreme changes, and we believe that the system will work again this time. We do see potential changes after this election, but it’s too early to alter investor portfolios.Remember what happened after the 2016 elections: markets rushed into sectors favored by Trump’s campaign promises. Those expectations were dashed and those favored areas of the market sold off in mid-2017, because the expectations in November 2016 did not reckon with what would/could actually get done in Congress. That kind of clarity may not occur until after the election. We favor focusing on the economy and using our June elections report (“Weighing the Impacts of a Potential Watershed Election”) as a guide to potential changes in the balance of congressional power. We also believe it will be useful to await a legislative agenda likely becoming clearer in January. Even if one party dominates Congress and takes the White House, there is a large risk to predicting whether that party can accomplish next year what it promises today. - Our current recommendations for the next 12 to 18 months follow the trends that we think will continue irrespective of who sits in the White House.
While concerns about the pandemic remain with us, we expect continued strong consumer demand for those services that allow people to shop/consume from home. This trend should continue to favor U.S. mid- and especially large-cap equities. We have favored Information Technology, Communication Services, and Consumer Discretionary since the pandemic broke upon us. We recently added Health Care as well. These are sectors with generally good balance sheets, good cash flow, and (because of potential strong demand still to come) good earnings prospects. We favor raising cash for these sectors by reducing holdings of the Energy and Real Estate sectors. We also favor reducing international equity (and fixed income) positions overseas and prefer U.S. markets. With volatility expected, we don’t foresee a need to push cash into the market all at once. Set up a plan with an investment professional to put money to work in a disciplined way on pullbacks.


